⚡ Quick Revision Box — Statistics Ex 14.4
- Exercise: 14.4 | Class 10 Maths | Chapter 14 — Statistics
- Total Questions: 3 (all involve ogive construction)
- Less Than Ogive: Plot (upper class limit, cumulative frequency) — curve rises left to right
- More Than Ogive: Plot (lower class limit, cumulative frequency) — curve falls left to right
- Median from Ogive: Draw horizontal line from N/2 on y-axis → drop perpendicular to x-axis
- Median Formula: \( M = l + \left(\frac{\frac{N}{2} – cf}{f}\right) \times h \)
- Board Exam Weightage: Statistics carries 11 marks in CBSE Class 10 Maths 2026-27
- Key Skill: Accurate plotting on graph paper and reading off median value
The NCERT Solutions for Class 10 Maths Chapter 14 Ex 14.4 on this page are fully updated for the 2026-27 CBSE board exam. Exercise 14.4 is the final exercise of the Statistics chapter and focuses entirely on the graphical representation of cumulative frequency distributions — specifically, drawing less than ogives and more than ogives. You can find all our NCERT Solutions organised by class and subject on this site.
This exercise has exactly 3 questions. All three require you to convert a frequency distribution table into a cumulative frequency table and then plot an ogive on graph paper. Question 2 also asks you to read the median from the graph and verify it using the formula. For the complete set of Class 10 Maths solutions, visit our NCERT Solutions for Class 10 hub. The official textbook is available on the NCERT official website.
- Quick Revision Box
- Chapter Overview — Statistics Class 10 Chapter 14
- Key Concepts — Ogives and Cumulative Frequency
- NCERT Solutions for Class 10 Maths Chapter 14 Ex 14.4 — All Questions
- Question 1 — Less Than Ogive: Daily Income of Workers
- Question 2 — Less Than Ogive and Median: Student Weights
- Question 3 — More Than Ogive: Production Yield
- Formula Reference Table
- Solved Examples Beyond NCERT
- Important Questions for Board Exam 2026-27
- Common Mistakes Students Make
- Exam Tips for CBSE Board 2026-27
- Frequently Asked Questions
Chapter Overview — Statistics Class 10 Chapter 14
Chapter 14 of the NCERT Class 10 Maths textbook covers Statistics. The chapter is divided into six sections: Introduction, Mean of Grouped Data, Mode of Grouped Data, Median of Grouped Data, Graphical Representation of Cumulative Frequency Distribution, and Summary. Exercise 14.4 belongs to Section 14.5 — Graphical Representation of Cumulative Frequency Distribution.
For CBSE board exams 2026-27, the Statistics chapter carries approximately 11 marks out of 80. Questions from this chapter appear in both the short-answer (SA) and long-answer (LA) sections. Ogive-based questions — the focus of Ex 14.4 — are popular 3-mark to 5-mark questions in board papers. Students who practise drawing ogives neatly on graph paper consistently score full marks.
Before attempting Exercise 14.4, you should be comfortable with: (1) frequency distribution tables, (2) the concept of cumulative frequency, and (3) the median formula for grouped data from Exercise 14.3. The cbse class 10 maths ncert solutions on this page follow the exact NCERT textbook sequence.
| Detail | Information |
|---|---|
| Chapter | 14 — Statistics |
| Exercise | 14.4 |
| Textbook | NCERT Mathematics — Class 10 |
| Subject | Mathematics |
| Total Questions | 3 |
| Marks Weightage | ~11 marks (full chapter) in CBSE 2026-27 |
| Difficulty Level | Medium |
| Key Skill | Drawing ogives and reading median from graph |
Key Concepts — Ogives and Cumulative Frequency
What is Cumulative Frequency? (संचयी बारंबारता)
Cumulative frequency (संचयी बारंबारता) is the running total of frequencies up to a certain class. You add each class frequency to the sum of all previous frequencies. It tells you how many data values fall below (or above) a certain boundary.
Less Than Ogive (न्यूनतम से संचयी बारंबारता वक्र)
A less than ogive is drawn by plotting the upper class limits on the x-axis against the corresponding less-than cumulative frequencies on the y-axis. The first point starts at (lower boundary of first class, 0) and the curve rises continuously from left to right, forming an S-shape. It is used to estimate the number of observations less than any given value.
More Than Ogive (अधिकतम से संचयी बारंबारता वक्र)
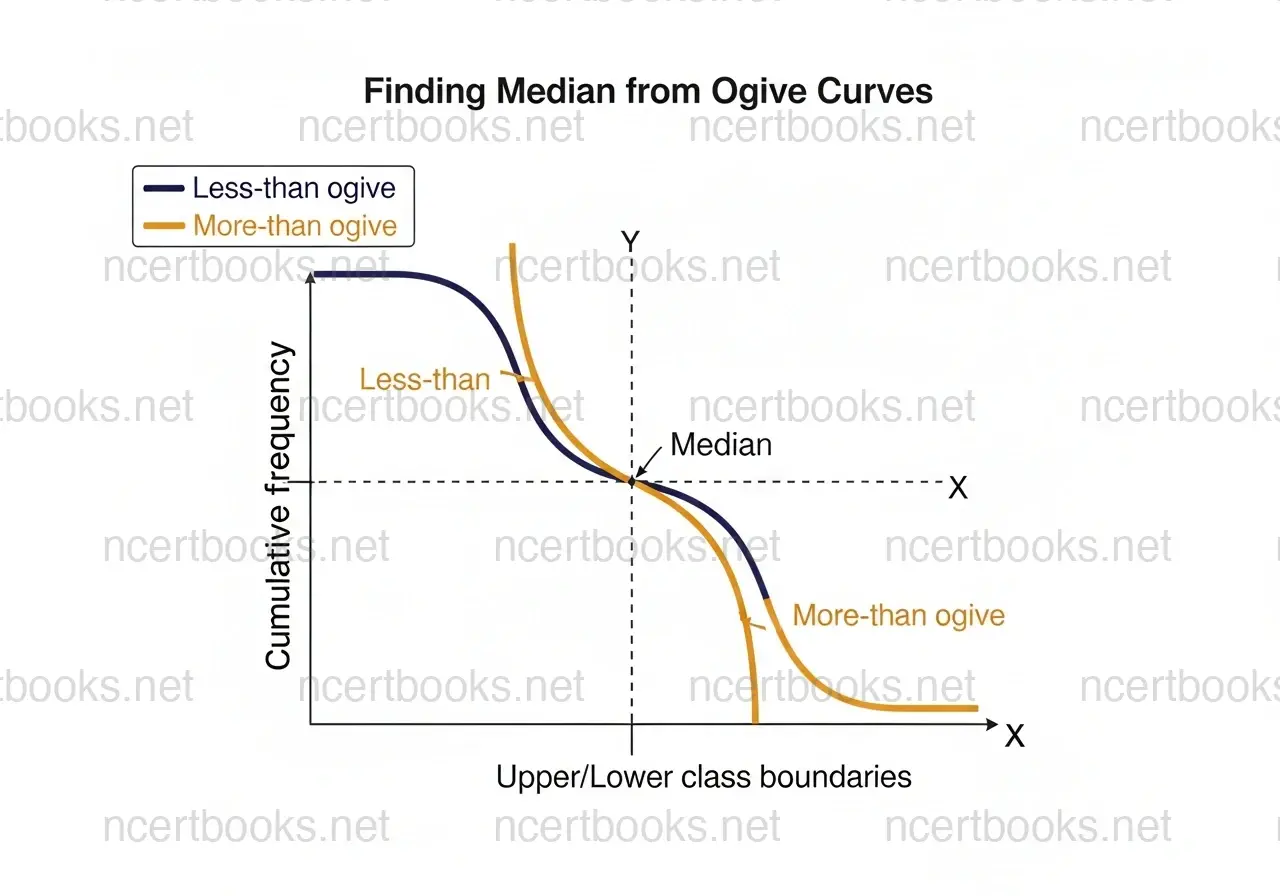
A more than ogive is drawn by plotting the lower class limits on the x-axis against the more-than cumulative frequencies on the y-axis. The cumulative frequencies decrease as you move right, so the curve falls from left to right. The intersection of the less than and more than ogives gives the median directly.
Reading the Median from an Ogive
To find the median graphically from a less than ogive: locate \( \frac{N}{2} \) on the y-axis, draw a horizontal line to meet the ogive, then drop a vertical line to the x-axis. The x-value at that point is the median. This graphical method should give the same result as the median formula \( M = l + \left(\frac{\frac{N}{2} – cf}{f}\right) \times h \).
NCERT Solutions for Class 10 Maths Chapter 14 Ex 14.4 — All Questions
Below are complete, step-by-step solutions for all 3 questions in Exercise 14.4. These ncert solutions for class 10 maths chapter 14 ex 14 4 are written to match the CBSE 2026-27 marking scheme. Show all table work and graph construction steps in your board exam answer.
Question 1 — Less Than Ogive: Daily Income of 50 Workers
Question 1
Medium
The following distribution gives the daily income of 50 workers of a factory.
Daily income (in ₹): 100–120, 120–140, 140–160, 160–180, 180–200
Number of workers: 12, 14, 8, 6, 10
Convert the distribution above to a less than type cumulative frequency distribution, and draw its ogive.
For a less than type distribution, we use the upper class limits and accumulate frequencies progressively.
| Daily Income (Upper Limit) | Frequency | Less Than Cumulative Frequency (cf) |
|---|---|---|
| Less than 120 | 12 | 12 |
| Less than 140 | 14 | 12 + 14 = 26 |
| Less than 160 | 8 | 26 + 8 = 34 |
| Less than 180 | 6 | 34 + 6 = 40 |
| Less than 200 | 10 | 40 + 10 = 50 |
Why does this work? Each row’s cumulative frequency tells us how many workers earn less than that upper limit. The final cumulative frequency must equal the total number of workers, i.e., 50.
The points to be plotted on the graph are the (upper class limit, cumulative frequency) pairs:
(120, 12), (140, 26), (160, 34), (180, 40), (200, 50)
We also start the ogive from the lower boundary of the first class with cumulative frequency 0: (100, 0).
So the complete set of points is: (100, 0), (120, 12), (140, 26), (160, 34), (180, 40), (200, 50).
On graph paper:
- Take the x-axis as Daily Income (₹) with scale: 1 cm = ₹20
- Take the y-axis as Cumulative Frequency with scale: 1 cm = 5 workers
- Plot all six points listed above
- Join the points with a smooth freehand curve (not straight lines)
- The resulting S-shaped curve is the less than ogive
Less Than Cumulative Frequency Table:
(100, 0) → (120, 12) → (140, 26) → (160, 34) → (180, 40) → (200, 50)
The ogive is an S-shaped curve passing through these six points.
Question 2 — Less Than Ogive and Median: Student Weights
Question 2
Hard
During the medical check-up of 35 students of a class, their weights were recorded as follows:
Weight (in kg): Less than 38, Less than 40, Less than 42, Less than 44, Less than 46, Less than 48, Less than 50, Less than 52
Number of students: 0, 3, 5, 9, 14, 28, 32, 35
Draw a less than type ogive for the given data. Hence obtain the median weight from the graph and verify the result by using the formula.
The data is already given in less than cumulative frequency form. The points to plot are:
| Weight (Upper Limit, kg) | Cumulative Frequency (cf) |
|---|---|
| Less than 38 | 0 |
| Less than 40 | 3 |
| Less than 42 | 5 |
| Less than 44 | 9 |
| Less than 46 | 14 |
| Less than 48 | 28 |
| Less than 50 | 32 |
| Less than 52 | 35 |
Total number of students \( N = 35 \).
Plot the points: (38, 0), (40, 3), (42, 5), (44, 9), (46, 14), (48, 28), (50, 32), (52, 35).
Join these points with a smooth freehand curve to get the less than ogive.
Step 3a: Calculate \( \frac{N}{2} \):
\[ \frac{N}{2} = \frac{35}{2} = 17.5 \]
Step 3b: On the y-axis, locate the point 17.5. Draw a horizontal line from this point parallel to the x-axis until it meets the ogive curve.
Step 3c: From the point of intersection, draw a vertical line (perpendicular) to the x-axis.
Step 3d: The x-axis value at this vertical line gives the median weight ≈ 46.5 kg.
Why does this work? The ogive represents the cumulative distribution. The value of x where cumulative frequency equals N/2 is, by definition, the median — exactly half the observations lie below it.
First, convert the less than cumulative frequency table back to a frequency distribution:
| Class Interval (kg) | Frequency (f) | Cumulative Frequency (cf) |
|---|---|---|
| 36 – 38 | 0 | 0 |
| 38 – 40 | 3 | 3 |
| 40 – 42 | 2 | 5 |
| 42 – 44 | 4 | 9 |
| 44 – 46 | 5 | 14 |
| 46 – 48 | 14 | 28 |
| 48 – 50 | 4 | 32 |
| 50 – 52 | 3 | 35 |
Step 4a: \( \frac{N}{2} = 17.5 \). Find the class whose cumulative frequency first exceeds 17.5. That is the class 46 – 48 (cf = 28 > 17.5).
Step 4b: Identify the values for the median formula:
- Lower class limit of median class: \( l = 46 \)
- Cumulative frequency before median class: \( cf = 14 \)
- Frequency of median class: \( f = 14 \)
- Class width: \( h = 2 \)
Step 4c: Apply the formula:
\[ M = l + \left(\frac{\frac{N}{2} – cf}{f}\right) \times h \]
\[ M = 46 + \left(\frac{17.5 – 14}{14}\right) \times 2 \]
\[ M = 46 + \left(\frac{3.5}{14}\right) \times 2 \]
\[ M = 46 + 0.25 \times 2 \]
\[ M = 46 + 0.5 = 46.5 \text{ kg} \]
\( \therefore \) Median weight = 46.5 kg
The graphical value (≈ 46.5 kg) and the formula value (46.5 kg) match exactly, confirming the result.
Question 3 — More Than Ogive: Production Yield per Hectare
Question 3
Medium
The following table gives production yield per hectare of wheat of 100 farms of a village.
Production yield (in kg/ha): 50–55, 55–60, 60–65, 65–70, 70–75, 75–80
Number of farms: 2, 8, 12, 24, 38, 16
Change the distribution to a more than type distribution, and draw its ogive.
For a more than type distribution, we use the lower class limits and subtract frequencies progressively from the total \( N = 100 \).
Why does this work? “More than 50” includes all 100 farms. “More than 55” excludes the first class (2 farms), so it has 98 farms, and so on.
| Production Yield (Lower Limit, kg/ha) | Frequency | More Than Cumulative Frequency (cf) |
|---|---|---|
| More than or equal to 50 | 2 | 100 |
| More than or equal to 55 | 8 | 100 − 2 = 98 |
| More than or equal to 60 | 12 | 98 − 8 = 90 |
| More than or equal to 65 | 24 | 90 − 12 = 78 |
| More than or equal to 70 | 38 | 78 − 24 = 54 |
| More than or equal to 75 | 16 | 54 − 38 = 16 |
The points to be plotted are (lower class limit, more than cumulative frequency):
(50, 100), (55, 98), (60, 90), (65, 78), (70, 54), (75, 16)
Note: The last point (75, 16) does not end at zero. The ogive ends when we reach the upper boundary of the last class. You may add the point (80, 0) to complete the curve.
On graph paper:
- Take the x-axis as Production Yield (kg/ha) with scale: 1 cm = 5 kg/ha
- Take the y-axis as Cumulative Frequency with scale: 1 cm = 10 farms
- Plot the points: (50, 100), (55, 98), (60, 90), (65, 78), (70, 54), (75, 16), (80, 0)
- Join the points with a smooth freehand curve
- The resulting curve falls from left to right — this is the more than ogive
More Than Cumulative Frequency Table:
(50, 100) → (55, 98) → (60, 90) → (65, 78) → (70, 54) → (75, 16) → (80, 0)
The ogive is a falling curve passing through these seven points.
Formula Reference Table — Statistics Chapter 14
| Formula Name | Formula | Variables Defined |
|---|---|---|
| Median (Grouped Data) | \( M = l + \left(\frac{\frac{N}{2} – cf}{f}\right) \times h \) | l = lower class limit of median class; N = total frequency; cf = cumulative frequency before median class; f = frequency of median class; h = class width |
| Mean (Direct Method) | \( \bar{x} = \frac{\sum f_i x_i}{\sum f_i} \) | \( f_i \) = frequency; \( x_i \) = class mark |
| Mode (Grouped Data) | \( Mo = l + \left(\frac{f_1 – f_0}{2f_1 – f_0 – f_2}\right) \times h \) | l = lower limit of modal class; \( f_1 \) = frequency of modal class; \( f_0 \) = frequency of class before modal class; \( f_2 \) = frequency of class after modal class; h = class width |
| Less Than Ogive Points | (Upper class limit, Less than cf) | Curve rises left to right |
| More Than Ogive Points | (Lower class limit, More than cf) | Curve falls left to right |
| Median from Two Ogives | x-coordinate of intersection of less than and more than ogives | Both ogives plotted on same graph |
Solved Examples Beyond NCERT — Ogive Practice
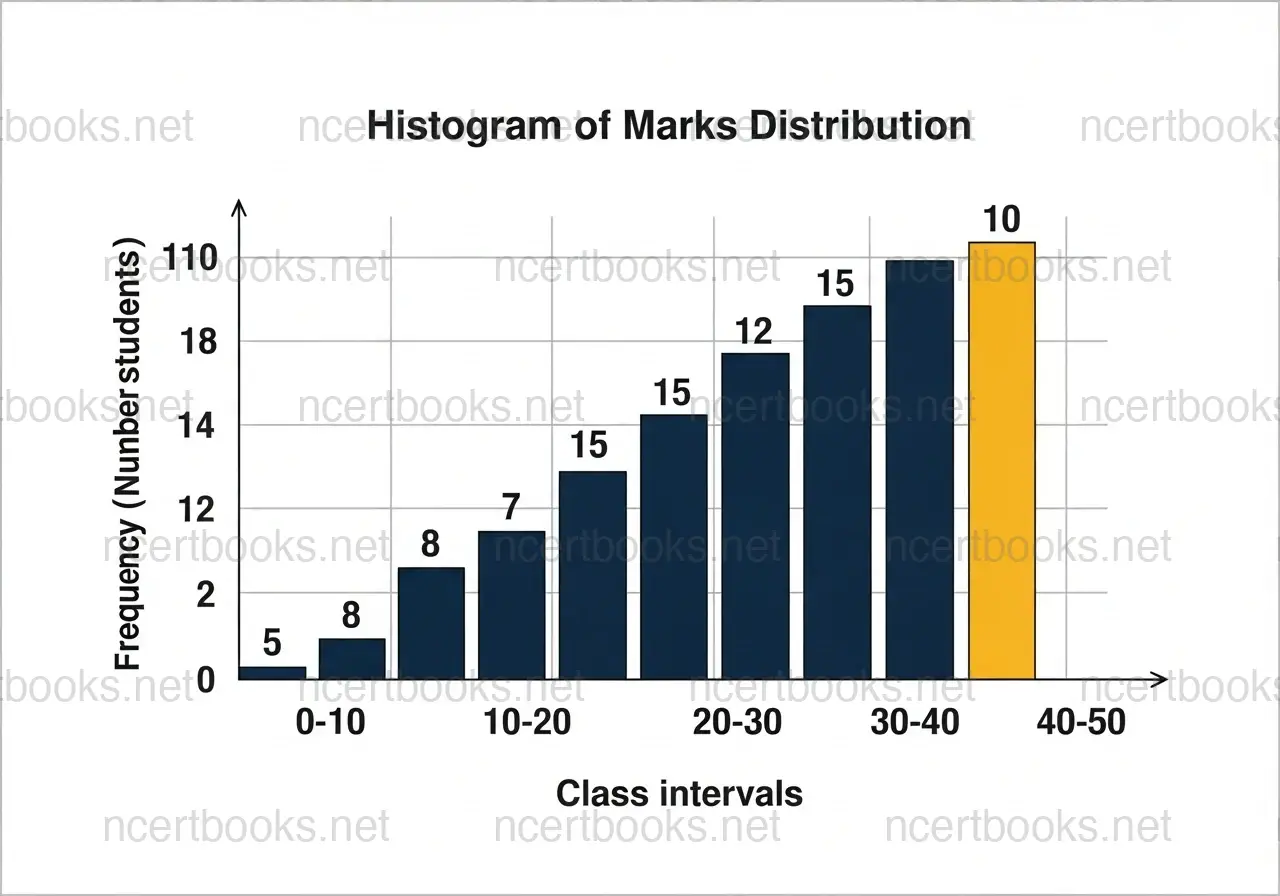
Extra Example 1 — Less Than Ogive for Marks Distribution
Easy
The marks of 40 students in a test are given below. Draw a less than ogive.
Marks: 0–10, 10–20, 20–30, 30–40, 40–50 | Frequency: 4, 6, 12, 10, 8
Step 1: Build the less than cumulative frequency table:
| Upper Limit | cf |
|---|---|
| Less than 10 | 4 |
| Less than 20 | 10 |
| Less than 30 | 22 |
| Less than 40 | 32 |
| Less than 50 | 40 |
Step 2: Plot points: (0, 0), (10, 4), (20, 10), (30, 22), (40, 32), (50, 40). Join with a smooth curve.
\( \therefore \) Less than ogive plotted through 6 points from (0,0) to (50,40).
Extra Example 2 — Median from Ogive for Age Distribution
Medium
A survey of 60 people’s ages gives the following less than cumulative frequency table. Find the median from the ogive.
Less than 20: 5, Less than 30: 15, Less than 40: 30, Less than 50: 48, Less than 60: 60
Step 1: Plot points: (20, 5), (30, 15), (40, 30), (50, 48), (60, 60). Add starting point (10, 0).
Step 2: \( \frac{N}{2} = \frac{60}{2} = 30 \). Locate 30 on y-axis, draw horizontal to ogive, drop vertical to x-axis.
Step 3: The vertical meets the x-axis at approximately 40.
\( \therefore \) Median age ≈ 40 years (read from graph).
Important Questions for Board Exam 2026-27 — Statistics Ex 14.4
1-Mark Questions
- Q: What type of curve is a less than ogive? A: An S-shaped (ogive) curve that rises from left to right.
- Q: In a more than ogive, which class limits are plotted on the x-axis? A: The lower class limits.
- Q: If N = 50, what value do you locate on the y-axis to find the median from a less than ogive? A: \( \frac{N}{2} = 25 \).
3-Mark Questions
Q1: The following data gives the marks of 30 students. Convert to a less than cumulative frequency distribution and list the points for the ogive.
Marks: 0–10 (f=2), 10–20 (f=5), 20–30 (f=8), 30–40 (f=10), 40–50 (f=5)
Answer: Less than cf: Less than 10 → 2; Less than 20 → 7; Less than 30 → 15; Less than 40 → 25; Less than 50 → 30. Points: (0,0), (10,2), (20,7), (30,15), (40,25), (50,30). Plot these and join with a smooth curve to get the less than ogive.
Q2: Explain how the intersection of a less than ogive and a more than ogive gives the median.
Answer: The less than ogive gives cumulative frequencies from below; the more than ogive gives cumulative frequencies from above. At the intersection point, the less than cf and more than cf are equal, which happens at exactly \( \frac{N}{2} \). Therefore, the x-coordinate of the intersection is the median of the distribution.
5-Mark Question
Q: The ages of 80 patients in a hospital are given below. Draw a less than ogive and find the median age from the graph. Verify using the formula.
Age (years): 10–20 (f=6), 20–30 (f=11), 30–40 (f=21), 40–50 (f=23), 50–60 (f=14), 60–70 (f=5)
Answer:
Step 1 — Cumulative Frequency Table:
| Upper Limit | cf |
|---|---|
| Less than 20 | 6 |
| Less than 30 | 17 |
| Less than 40 | 38 |
| Less than 50 | 61 |
| Less than 60 | 75 |
| Less than 70 | 80 |
Step 2 — Ogive Points: (10,0), (20,6), (30,17), (40,38), (50,61), (60,75), (70,80). Plot and join smoothly.
Step 3 — Median from Graph: \( \frac{N}{2} = 40 \). From y = 40, draw horizontal to ogive, drop vertical → median ≈ 40 years.
Step 4 — Formula Verification: Median class = 40–50 (cf just exceeds 40 at cf=61). \( l=40, cf=38, f=23, h=10 \).
\[ M = 40 + \left(\frac{40 – 38}{23}\right) \times 10 = 40 + \frac{20}{23} \approx 40 + 0.87 = 40.87 \text{ years} \]
The graphical estimate (~40) and formula value (~40.87) are very close, confirming the result. (Small difference is due to reading precision on graph paper.)
Common Mistakes Students Make in Ogive Questions
Mistake 1: Using lower class limits for a less than ogive.
Why it’s wrong: Less than ogive requires upper class limits on the x-axis. Using lower limits gives a completely wrong graph.
Correct approach: Always use upper class limits for less than ogive; use lower class limits for more than ogive.
Mistake 2: Joining ogive points with straight lines instead of a smooth curve.
Why it’s wrong: An ogive is a cumulative frequency curve, not a polygon. Straight lines give a cumulative frequency polygon, which is a different graph.
Correct approach: Join all points with a smooth freehand S-shaped curve.
Mistake 3: Forgetting to start the less than ogive from (lower boundary of first class, 0).
Why it’s wrong: Without the starting point, the curve is incomplete and you lose marks.
Correct approach: Always add the point (lower boundary of first class, 0) before plotting other points.
Mistake 4: Not verifying the median using the formula when the question asks for it.
Why it’s wrong: Question 2 of Ex 14.4 specifically says “verify the result by using the formula.” Skipping this step loses 2–3 marks.
Correct approach: After reading the median from the graph, always apply \( M = l + \left(\frac{\frac{N}{2} – cf}{f}\right) \times h \) and show the calculation.
Mistake 5: Using the wrong class for the median formula — picking the class where cf equals N/2 exactly instead of the class where cf first exceeds N/2.
Why it’s wrong: The median class is the one whose cumulative frequency first becomes greater than or equal to N/2.
Correct approach: Scan the cf column and find the first row where cf ≥ N/2. That row’s class interval is the median class.
Exam Tips for CBSE Board 2026-27 — Statistics Chapter 14
- Graph paper is essential: In board exams, ogive questions require neat graph paper work. Use a sharp pencil, ruler for axes, and freehand for the curve. Label axes with units.
- Show the cumulative frequency table: Even if the question only asks for the ogive, writing the cumulative frequency table earns you step marks in the CBSE 2026-27 marking scheme.
- Mark N/2 clearly on graph: When finding the median from an ogive, draw the horizontal and vertical construction lines clearly and label the median value on the x-axis. Examiners look for this.
- Statistics chapter weightage: The Statistics chapter (Chapter 14) carries approximately 11 marks in the CBSE Class 10 Maths board exam 2026-27. Ogive questions from Ex 14.4 typically carry 3–5 marks each.
- Both ogives on one graph: If asked to draw both less than and more than ogives on the same graph, their intersection gives the median directly. Label the intersection point clearly.
- Revision checklist:
- ✅ Know how to build less than and more than cumulative frequency tables
- ✅ Know which class limits to use for each type of ogive
- ✅ Practise reading N/2 on the y-axis and dropping perpendicular to x-axis
- ✅ Memorise the median formula and practise identifying l, cf, f, h correctly
- ✅ Practise all 3 questions in Ex 14.4 on actual graph paper before the board exam
Frequently Asked Questions — NCERT Solutions Class 10 Maths Chapter 14 Ex 14.4
How do you draw a less than ogive for Class 10 Maths Chapter 14?
To draw a less than ogive, first convert the frequency distribution into a less than cumulative frequency table by using the upper class limits. Plot points with the upper class boundary on the x-axis and cumulative frequency on the y-axis, starting from (lower boundary of first class, 0). Join the points with a smooth freehand S-shaped curve. This rising curve is the less than ogive and is used in all three questions of Exercise 14.4.
How do you find the median from an ogive in Class 10?
Locate \( \frac{N}{2} \) on the y-axis (where N is the total number of observations). Draw a horizontal line from this point until it meets the less than ogive curve. From the intersection, drop a perpendicular to the x-axis. The x-axis value at that point is the median. This method is used in Question 2 of Exercise 14.4, where the result is then verified using the median formula.
What is the difference between a less than ogive and a more than ogive?
A less than ogive uses upper class limits on the x-axis and cumulative frequencies that increase from left to right, forming a rising S-curve. A more than ogive uses lower class limits on the x-axis and cumulative frequencies that decrease from left to right, forming a falling curve. When both ogives are drawn on the same graph, their intersection point gives the median of the distribution directly.
How many questions are in Exercise 14.4 of Class 10 Maths NCERT?
Exercise 14.4 of Class 10 Maths NCERT Statistics chapter contains exactly 3 questions. Question 1 asks for a less than ogive for daily income data of 50 workers. Question 2 asks for a less than ogive for student weight data and also requires finding and verifying the median. Question 3 asks for a more than type distribution and ogive for production yield data.
Is Exercise 14.4 Statistics important for CBSE Board Exam 2026-27?
Yes, Exercise 14.4 is important for the CBSE Board Exam 2026-27. The Statistics chapter carries approximately 11 marks, and ogive-based questions from this exercise regularly appear in board papers. Students are expected to draw ogives accurately on graph paper and read off the median. Practising all three questions in this exercise — especially Question 2 with median verification — is strongly recommended for scoring full marks.
Where can I find ncert solutions for class 10 maths in Hindi for Chapter 14 Exercise 14.4?
You can find ncert solutions for class 10 maths in Hindi (प्रश्नावली 14.4 का हल) on our NCERT Solutions for Class 10 page. The Hindi medium solutions follow the same step-by-step approach as the English solutions. The official NCERT Hindi medium textbook (Ganit) is also available on the NCERT official website for free download.